MIX: YL/YH- 3 sessions Day change-5 EMAS for FXCM by BlackwolfThis is a multi script: it shows the day session from midnight to midnight, asia - europe- america sessions , Yesterday Hi & yesterday Low and 5 EMAS at 5,13,50,200,800
Rome Time Based for FXCM Broker
[b]forex

Opening asian Range 7 h FXCM by Blackwolf v2.1It works with FXCM and is configured for Admiral Markets Broker.
It shows the min and max price reached in Asian Session
Lo script lavora con FXCM e configurato per Broker Admiral Markets
Mostra il massimo ed il minimo del prezzo raggiunto durante la sessione asiatica.

Forex Sessions-By Blackwolf for FXCM 00:00-24:00 V2.1This script uses FXCM as reference and it has been configured to work with the time fo Admiral Markets broker
It shows vertical lines for the midnight of everyday.
It shows three different trading sessions: Asia Europe America
It is configured for Rome Time Zone
Script da utilizzare con broker FXCM per la correttezza e la corrispondenza automatica della mezzanotte
Lo script segna automaticamente delle linee verticali in corrispondenza della mezzanotte dal lunedì al venerdì in modo da definire chiaramente l'inizio e la fine della giornata.
Inoltre le sessioni di trading giornaliere Asia, Europa, America vengono evidenziate con delle fasce colorate per definire le diverse sessioni di mercato sincronozzate con Broker Admiral Markets.
Lo script ha come orario di base il fuso West America ed è già stato preimpostato per avere la corrispondenza esatta con le varie sessioni in funzione dell' orario di Roma (US 18.00 = Roma 00.00)

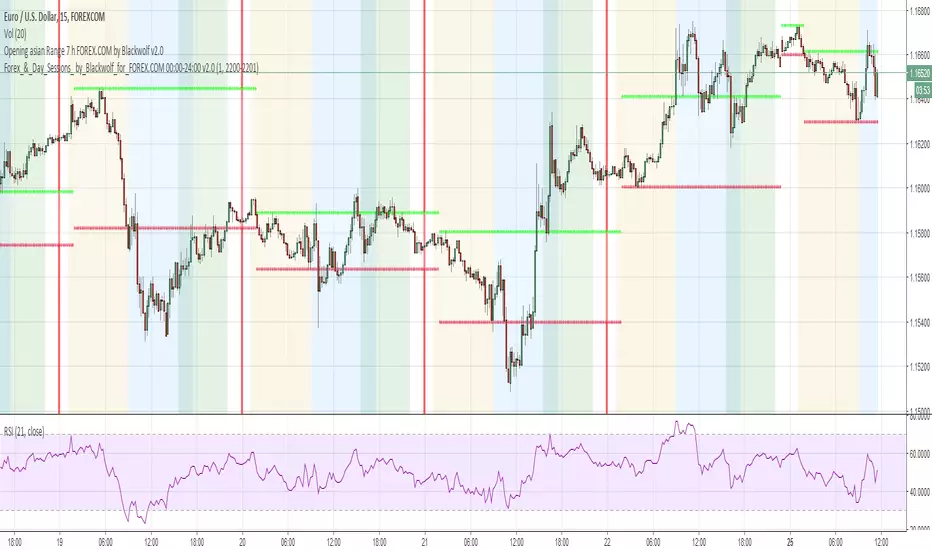
Forex-&-Day-Sessions-By Blackwolf for FOREX.COM 00:00-24:00 v2.0Script for Broker FOREX.COM for the correct midnight hour
It shows a vertical line at midnight of every day.
It also marks with different colors three daily sessions: Asia, Europe and America
The time zone is for Rome
Script da utilizzare con broker FOREX.COM per la correttezza e la corrispondenza automatica della mezzanotte
Lo script segna automaticamente delle linee verticali in corrispondenza della mezzanotte dal lunedì al venerdì in modo da definire chiaramente l'inizio e la fine della giornata.
Inoltre le sessioni di trading giornaliere Asia, Europa, America vengono evidenziate con delle fasce colorate per definire le diverse sessioni di mercato.
Lo script ha come orario di base il fuso West America ed è già stato preimpostato per avere la corrispondenza esatta con l'orario di Roma (US 18.00 = Roma 00.00)

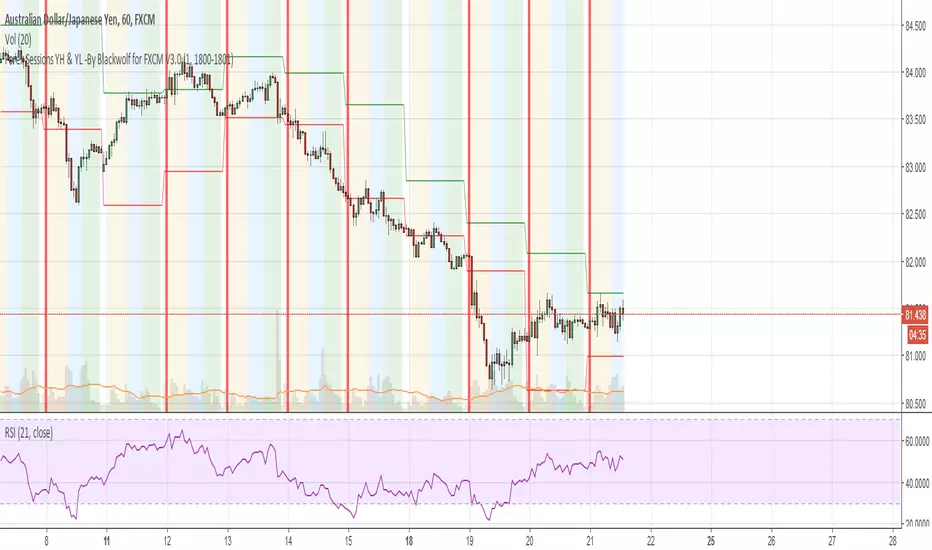
Forex Sessions YH & YL -By Blackwolf for FXCM V3.0This script is used to mark asian, european and american session for broker FXCM and it shows the yesterday high and yesterday low
Italian Translation
Indicatore per segnare sessioni Asiatica Europea ed Americana con Broker FXCM 5.18% ed inoltre traccia anche lo Yesterday High e Yesterday Low (massimo e minimo del giorno precedente).
Forex-Sessions-for FXCM 00:00-24:00 Sessione Asiatica, Europea ed Americana settate secondo i seguenti parametri:
ASIAN SESSION: 01.00 - 08.00 GMT+1
EUROPEAN SESSION: 08:00 - 14:00 GMT+1
NY SESSION: 14:00 - 21.30 GMT+1

Ppsignal Stochastic Momentum IndexSMI is a stoch and momentun oscillator, make oversold and Overbought signal.

SignalToSignal.com Volume Trend AdvisorThe Signal to Signal Volume Trend Advisor is a proprietary volume and priced-based trend predictor. Leveraging over 20 years of volume-price trading and systems development, we utilize proprietary Volume Spread Analysis ( VSA ) concepts and internal market dynamics to alert you visually and in real time of an imminent trend change.
The indicator was developed to keep autonomous trading systems on track while a trader is away from their charts. While it is meant to be used in conjunction with other trading systems and methods as a filter or as confluence, VTA also stands strongly on its own.
The trend analysis algorithm indicates trend changes visually and in realtime based on static, non-lagging market information. This means that the Volume Trend Advisor does not and cannot repaint, ensuring any signal received is valid and actionable.
Large moves are captured and even trades that result in a small loss when taken to the next signal generally move some significant amount in the direction of the signal, meaning that given proper trade management, even a failed trend can still be profitable.
Because the indicator works using volume and price data, the Volume Trend Advisor works well on any chart. We personally use the indicator to successfully trade Stocks, Forex, Commodities, and Crypto Charts such as Bitcoin ( BTC ).
To gain access to the Volume Trend Advisor, please visit our website - signaltosignal.com
If you have any questions, please contact us through the Contact link on our website - signaltosignal.com

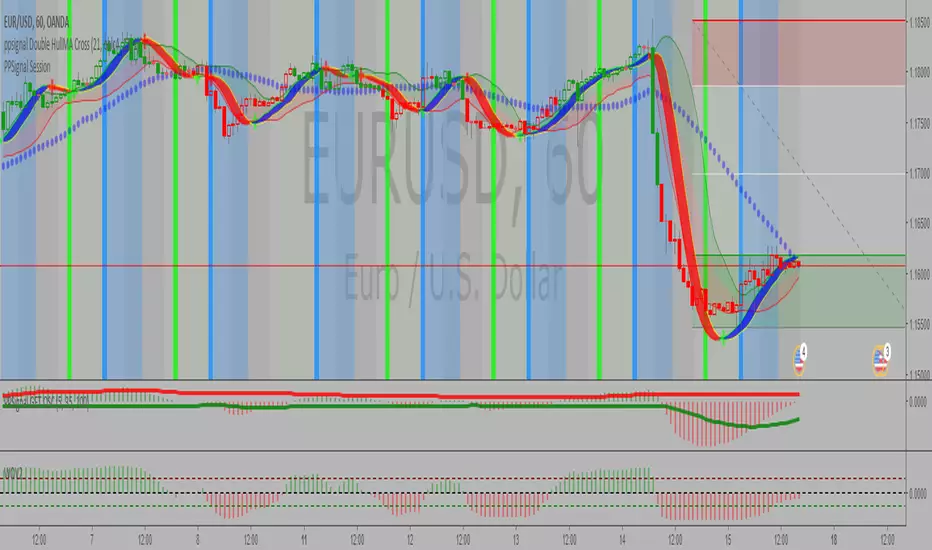
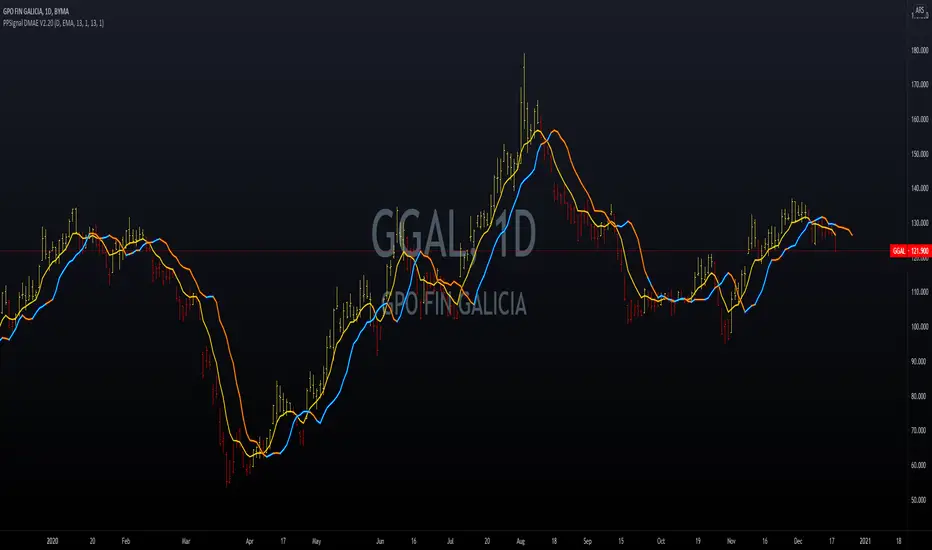
Ppsignal Displaced Moving Average Exponential MTFWe have a get advance MA...7 displaced 5 period...and 34 sma for referencia wave 2 and 4
PPSignal - Trend OverlayPpsignal trend overlay is based in macd projection 21 34 13 period on the chart price or overlay.

PPSignal GET OSCSimilar to lbr and ewo oscillator, Get oscillator have the break band volatility indicator.

Ppsignal Candle Converter V1With this system you can see the candle time converter for example if you are in 5m timeframe you can see the hour candle formation.

Currency Strength Meter (by vitelot)This script estimates the relative strength of forex major currencies.
It works in any timeframe with no input required.
The only parameter is used to smooth the curves and can be set to 1 to have the original, but noisy, signals.
Comments are welcome, and please push the like button if you find it useful.
Cheers.
PS Curious that this kind of indicator is not yet on tradingview, at least I could not find anything similar. Do you know any?

Gap finder (gold minds)This tool highlights where gaps happens and outlines in the chart where the gap zones are. If there is a gap up there is a green line, a gap down it is red. The gap zone is highlighted in blue. You can choose the size of your gap with the input menu to the desired size. Feel free to ask comment below. Made for the Gold Minds group

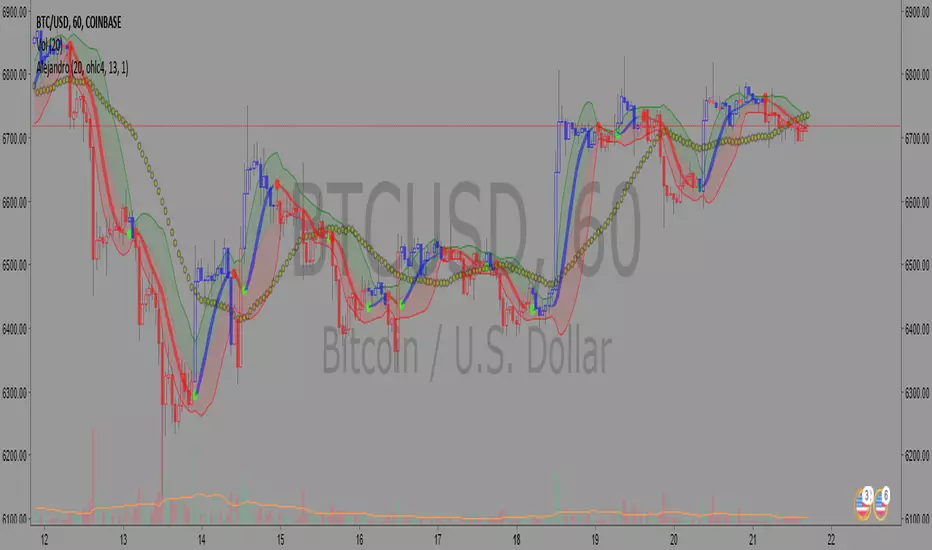
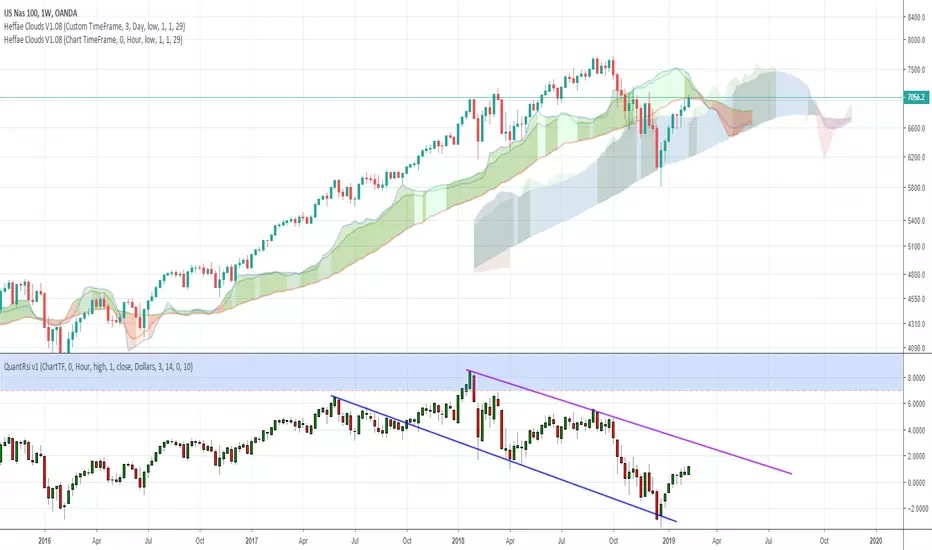
Heffae Clouds v1.00Heffae Clouds v1.0 - Ichimoku Modernized
Heffae Clouds Alpha release Version 1.0
Heffae Clouds functions as adaptive support and resistance. It has real-time paths and offset clouds, similar to ichimoku.
Paths are calculated by the complex discovery of prior behaviour for any crypto or forex asset.
Uses 5 single layer networks to calculate the optimal path fitting for any asset or timeframe.
The cloud color provides granular detail on path validity.
Please see the pastebin link for access information and links:
pastebin.com
Video introduction and trading strategy:
Some Beta-tester comments:
"It's like now having a microscope if you get what I mean. Which says great things about what you have done here. Love it man"
"I just find myself makes so many good decisions with your system it's hard to believe"
"this is without a doubt an improvement of Ichimoku (Which is my favorite tool by far). So much more info with your cloud system.."

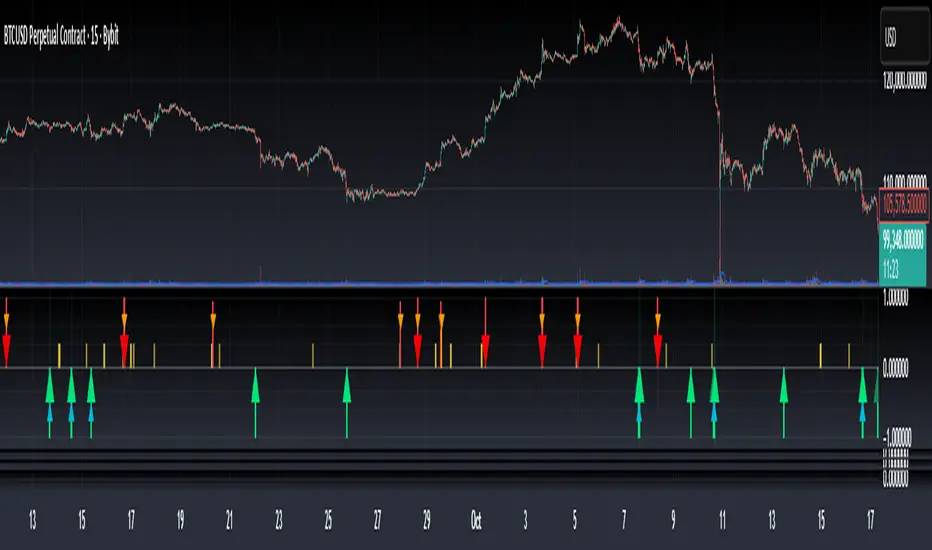
Bottom & Top Finder v3.0Bottom & Top Finder v3.0 is a proprietary multi-component oscillator designed to identify potential market reversals and extreme price conditions. The indicator analyzes momentum, volatility, and price behavior to generate bullish and bearish signals with strength classification.
█ OVERVIEW
Each signal is classified into three strength levels (Weak, Medium, Strong) allowing traders to prioritize high-conviction setups.
Signal Classification:
• Strong signals (±1.0): High conviction setups with multiple confirmations
• Medium signals (±0.6): Moderate conviction with key component alignment
• Weak signals (±0.33): Early warnings or preliminary indications
█ KEY FEATURES
Smart Signal Management
The indicator includes an intelligent system that allows signal sequences to complete naturally while preventing excessive noise. Unlike traditional cooldown systems that block all signals during a cooldown period, this implementation allows consecutive signals during a "run" and only applies cooldown after the signal run ends. This ensures complete multi-bar patterns are captured while preventing rapid flip-flopping.
Advanced Filtering System
Three optional filters allow adaptation to different market conditions:
• Volume Confirmation Filter: Validates signals against recent volume activity across a configurable lookback period. Checks if any bar in the lookback window exceeded average volume by the specified multiplier.
• Trend Alignment Filter: Four operational modes including With Trend, Counter Trend, Statistical Distance, or Off. The anomaly mode uses calculations to identify signals only at statistical extremes rather than simple directional bias.
• Signal Type Selection: Enable or disable weak, medium, and strong signals independently based on your trading style and risk tolerance.
Comprehensive Alert System
Ten distinct alert conditions cover every use case. Alerts include price level and timestamp, and are ready for webhook integration with automated trading systems.
█ HOW TO USE
Basic Setup
1 — Add "Bottom & Top Finder v3.0" to your chart in a separate indicator pane
2 — Optionally add "Bottom & Top Finder v3.0 - Chart Labels" for on-chart visual markers
3 — Configure lookback periods (defaults work well for most timeframes)
4 — Enable or disable signal strengths based on your trading style
5 — Apply filters as needed to reduce noise in your specific market
Signal Interpretation
Histogram magnitude indicates signal conviction. Multiple signal types can fire simultaneously and are aggregated into the composite score.
Alert Configuration
Set up alerts through TradingView's standard alert system using the built-in alert conditions. Choose from individual signal types (for specific setups) or aggregate alerts (for broader monitoring).
Recommended Approach
• Combine indicator signals with price action and support/resistance analysis
• Use strong signals for entries, weaker signals for early warnings or exits
• Enable filters when trading liquid markets with reliable volume data
• Adjust cooldown period based on timeframe: lower for active trading, higher for swing setups
• Start with default settings and adjust based on backtesting results
█ SETTINGS
Lookback Settings
• Main Lookback Period: Primary calculation period for most components (default: 21). Lower values increase sensitivity, higher values smooth signals.
• Range Lookback: Extended lookback for range high/low analysis (default: 50). Affects extreme condition detection.
Signal Settings
• Enable Weak Signals: Toggle weak signal detection (default: on)
• Enable Medium Signals: Toggle medium signal detection (default: on)
• Enable Strong Signals: Toggle strong signal detection (default: on)
Filter Settings
• Enable Volume Filter: Require volume confirmation (default: off)
• Volume Lookback: Period to check for volume spikes (default: 30)
• Volume Spike Multiplier: Threshold above average volume (default: 1.3x)
• Trend Filter Mode: Off, With Trend, Counter Trend, or Anomaly (default: off)
• Trend SMA Period: Moving average period for trend calculations (default: 50)
• Anomaly Threshold: Minimum statistical deviation for anomaly mode (default: 1.5)
Display Settings
• Show Composite Histogram: Toggle main histogram display (default: on)
• Show Signal Bars: Toggle triangle markers in indicator pane (default: on)
• Show RSI Reference: Overlay normalized RSI for context (default: off)
█ TIMEFRAME CONSIDERATIONS
The indicator works on any timeframe from 1-minute to monthly charts. However, optimal performance requires timeframe-appropriate configuration:
Shorter Timeframes (1m-15m)
Consider reducing main lookback period for increased responsiveness. Volume filter may be less reliable in some markets during low-liquidity sessions.
Medium Timeframes (1H-4H)
Default lookback periods are optimized for these timeframes. Volume and trend filters provide good noise reduction.
Longer Timeframes (1D+)
Consider increasing lookback periods for smoother signals. Filters are highly effective at these timeframes.
█ BEST PRACTICES
Risk Management
This indicator is a technical analysis tool designed to identify potential reversal zones and does not guarantee profitable trades. Users should:
• Understand that signals indicate potential setup zones, not guaranteed outcomes
• Employ proper position sizing and risk management on every trade
• Combine indicator signals with their own analysis and trading strategy
• Paper trade and backtest thoroughly before live implementation
• Never risk more than they can afford to lose
Signal Context
Indicator signals should be evaluated within broader market structure. Consider:
• Proximity to key support and resistance levels
• Overall trend direction and strength
• Market volatility and liquidity conditions
• Confluence with other technical indicators or patterns
• Fundamental factors that may override technical signals
█ NOTES
• All signals use confirmed bar data and do not repaint
• The cooldown system tracks top and bottom signals independently
• Multiple signal types can fire simultaneously; the composite score aggregates them
• Anomaly mode measures standard deviation magnitude, not just directional bias
• Volume filter checks any bar in the lookback period, not just the current bar
• Strong signals require more confirmations than medium or weak signals
Top Finder 1.1Top Finder is an automated cryptocurrency signals and analysis tool which uses a complex algorithm involving multiple indicators, trends, and cross-overs including proprietary formulas developed in-house to predict the top or near top price of cryptocurrencies. It also works well on stocks, gold, oil and forex, even soybeans!
Top Finder is the sister indicator to Bottom Finder (check my other scripts).
Signal strength is represented by height/color of the signal. (Taller signal = stronger signal).
